The solar companies in the United States of America have installed a total of 3.8 gigawatts (GW) of solar power capacity in the third quarter of the year 2020. This is according to the report released by the Solar Energy Industries Association (SEIA) and Wood Mackenzie.
Source: Wood Mackenzie U.S. Solar Market Insight Q4 2020
As stated in the SEIA’s U.S. Solar Market Insight Q4 2020, the solar industry is reportedly thriving and accounting for 43% of all new additional power-generating capacity through the 3rd quarter of 2020. A record of 19 gigawatts (GW) of new solar PV installations is being projected by the end of the year. This will represent a 43% year-over-year increase from 2019.
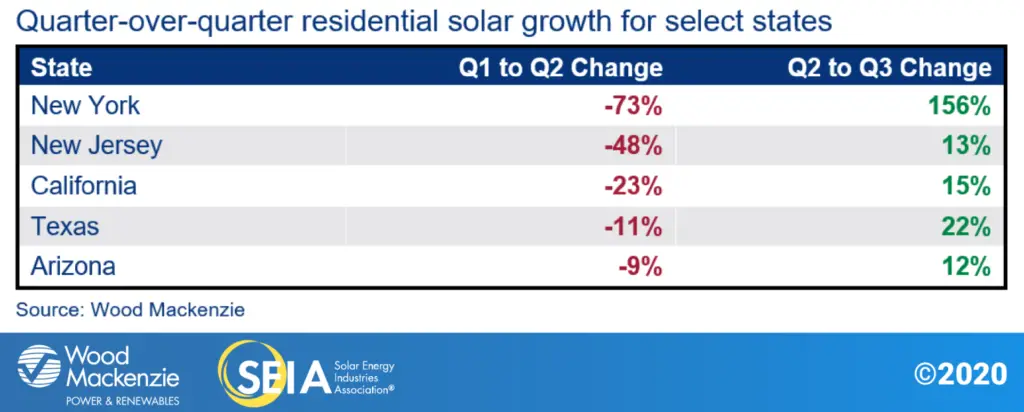
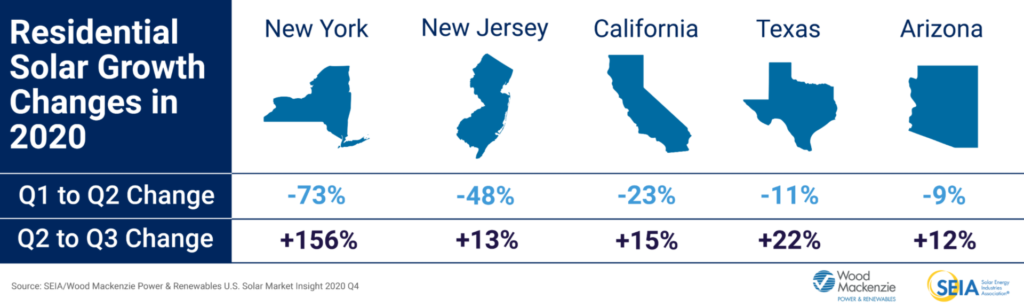
Quarter-over-quarter residential solar growth for select states in the U.S.
Which State Has Installed the Most Solar Panels?
According to the data presented by SEIA for the year 2020, here is the list of states as ranked in terms of MWdc (Megawatts-DC) of solar power capacity installed in the United States of America.
State
2020 YTD
2019
2018
Texas
1
2
2
Florida
2
3
4
California
3
1
1
South Carolina
4
7
13
Virginia
5
19
14
North Carolina
6
6
3
New York
7
8
6
New Jersey
8
9
8
New Mexico
9
22
20
Georgia
10
5
39
Oregon
11
18
17
Massachusetts
12
13
10
Arizona
13
4
9
Pennsylvania
14
25
25
Illinois
15
21
33
Arkansas
16
36
12
Colorado
17
14
11
Utah
18
20
26
Minnesota
19
12
7
Ohio
20
27
29
2020 vs 2019 vs 2018 Top 20 States with Most Solar PV Installed
Texas has recorded a total of 2,401 MWdc of solar panel installation in 2020 (year-to-date), garnering the top #1 spot. Florida, in the 2nd highest-ranking, has installed 2,040 MWdc of solar power capacity this year. Meanwhile, the state of California installed 1,808 MWdc of solar while also falling to the 3rd spot, coming from being the top seed for the previous years – 2018 and 2019.
Among many other states, New Mexico has also been noteworthy by climbing up to 9th place this year. This is a huge jump in its solar power capacity rankings, considering it was only on the 22nd spot last year.
The solar market thrives ahead in 2020’s third quarter as residential solar installations recover and utility-scale pipeline grows.
What happened to the residential US solar market in 2020?
In terms of the business impacts of the COVID-19 pandemic, the residential solar market has been hit the hardest. However, it has beaten the expected recovery rate by growing 14% over the 2nd quarter.
The SEIA Q3 2020 report shows that most of the solar PV installations of Q3 were primarily driven by the utility-scale market as it represented 70% of the overall solar capacity. This reportedly amounts to 2.7 Gigawatts of new solar installs.
US Solar Companies Installed 3.8 GW of New Solar PV Capacity in 2020 Q3 Alone
Description
The solar companies in the United States of America have installed a total of 3.8 gigawatts (GW) of solar power capacity in the third quarter of the year 2020. This is according to the report released by the Solar Energy Industries Association (SEIA) and Wood Mackenzie.
He loves to read news and articles about renewable energy and technology. He is experienced in the solar energy industry. He loves to write articles, guides, and tutorials about solar PV technology.